Methods for Determining Photosynthetic Rate in Plant Physiology
 libre
libre
The rate of photosynthesis is measured in plant physiology through three main approaches: tracking the carbon dioxide absorbed, the oxygen released, or the organic matter accumulated by the plant.
Methods for determining the rate of photosynthesis
Photosynthesis rate can be determined by measuring any one of the reaction's measurable inputs or outputs. The three classic methods are:
- by the amount of carbon dioxide absorbed;
- by the oxygen released;
- by the organic matter accumulated during photosynthesis.
To these established laboratory methods, modern plant science adds non-destructive techniques such as chlorophyll fluorescence and infrared gas analysis, which allow continuous measurement on living, intact leaves. The choice of method depends on the question being asked, the equipment available, and whether the plant material can be destroyed in the process.
What the rate of photosynthesis is and why it is measured
The rate of photosynthesis is the amount of carbon dioxide fixed, oxygen produced, or dry matter built up by a plant per unit of time, usually expressed per unit leaf area. Measuring it matters because photosynthesis is the primary process by which energy enters almost every food chain on Earth and by which atmospheric carbon dioxide is removed and oxygen replenished. Quantifying global photosynthesis rates helps scientists model the carbon cycle, while measuring it in individual crops drives yield prediction and breeding.
The importance of photosynthesis to life extends from the cellular to the planetary scale: it supplies the organic compounds that feed heterotrophs and the oxygen that aerobic organisms breathe. For research and production alike, knowing how fast a given plant photosynthesises under given conditions is the foundation of agronomy, forestry, ecology, and crop physiology.
The chemical equation of photosynthesis and what underlies it
Photosynthesis is the process in which green plants use light energy captured by chlorophyll to convert carbon dioxide and water into glucose and oxygen. The overall reaction is summarised by the equation:
6CO2 + 6H2O + light energy → C6H12O6 + 6O2
This single equation explains why all three measurement strategies work: carbon dioxide is consumed, oxygen is released, and carbohydrate (and therefore dry mass) is produced in fixed proportions. The reaction proceeds in two stages — the light-dependent reactions, which split water and generate ATP and reduced coenzymes, and the light-independent (Calvin cycle) reactions, which fix carbon dioxide into sugar. Tracking any of the boxed quantities in the equation gives an estimate of the overall rate.
Determining photosynthesis by the amount of carbon dioxide absorbed
Measuring carbon dioxide uptake estimates photosynthesis by tracking how much CO2 the plant removes from a known volume or stream of air. Because carbon dioxide concentration directly controls the rate of carbon fixation, its disappearance is a sensitive indicator of photosynthetic activity. Two classical Russian methods — one in a closed space and one in a flowing air stream — established the principle, and modern gas analysers refined it.
The L. A. Ivanov and N. L. Kossovich method (closed system)
The Ivanov–Kossovich method measures carbon dioxide uptake in a sealed (closed-system) flask containing the plant, compared against an identical control flask without a plant.

In this closed-system method, the amount of carbon dioxide is measured in a round-bottomed flask after the plant has been enclosed in it, and simultaneously in a control flask. Barium hydroxide solution is poured into both flasks and titrated with oxalic acid in the presence of an indicator, both before and after the experiment. The difference between the control and the experimental flask reveals how much carbon dioxide the plant absorbed. The illustration shows the apparatus during a determination.
The T. A. Krasnoselskaya-Maksimova and A. G. Ordoyan method (air stream)
The Krasnoselskaya-Maksimova and Ordoyan method measures carbon dioxide uptake in a flowing air stream (an open-system approach), passing air over a leaf and then through an absorber that traps the remaining CO2.

1 — aspirator, 2 — rubber stopper connecting the absorber to the aspirator, 3 — absorber, 4 — leaf chamber. The arrows show the direction of airflow.
A titrated barium hydroxide solution poured into the absorber captures the carbon dioxide. The plant leaf is placed in the receiver chamber, and air passing through it continues into the absorber, where the remaining carbon dioxide is absorbed. A control determination is run simultaneously without a plant. The experiment lasts 20–30 minutes, after which the barium hydroxide in the absorber is titrated with oxalic acid. The contrast between open and closed systems is fundamental: a closed system measures the depletion of a fixed CO2 pool, whereas an open system measures the difference between incoming and outgoing air.
CO2 gas analysers and infrared gas analysis (IRGA)
The infrared gas analyzer (IRGA) is today's standard instrument for measuring carbon dioxide exchange, and it replaced the laborious titration methods for most research. IRGA technology exploits the fact that carbon dioxide strongly absorbs infrared radiation: beams of infrared light are passed alternately through a chamber containing the leaf and through a reference chamber, and the degree of absorption indicates the CO2 concentration in the analysed air.
By the degree of absorption one judges the CO2 content of the analysed air. Because the analyser is fitted with a recorder, an IRGA can monitor photosynthesis continuously over long periods, producing a real-time trace of carbon dioxide uptake rather than a single before-and-after value. This continuous output is what makes IRGA suited to field studies and to detecting rapid responses to changing light or temperature.
Electrochemical gas sensors and CO2 monitors
Electrochemical gas sensors offer a compact, lower-cost alternative for monitoring carbon dioxide in photosynthesis studies and growing environments. An electrochemical gas sensor generates a small electrical current proportional to the gas concentration it contacts, allowing portable CO2 monitors to log changes in a chamber or greenhouse. While generally less precise than research-grade IRGA, these sensors are widely used in precision agriculture and controlled-environment horticulture where continuous, networked monitoring matters more than laboratory accuracy.
Determining photosynthesis by oxygen release
Measuring oxygen production estimates photosynthesis by collecting and quantifying the gas evolved by an illuminated aquatic plant. Oxygen release is a convenient indicator because the bubbles are visible and the gas can be trapped and measured directly, making this method a staple of school and introductory laboratory work.
The Elodea experiment and measuring the rate of oxygen evolution
Photosynthesis can be observed directly through oxygen release using the aquatic plant Elodea (a pondweed). Sprigs of Elodea are placed in a jar of water with their cut ends upward and covered with a glass funnel, over which a water-filled test tube is inverted. Oxygen evolving from the cut stems displaces water from the test tube, and the volume collected over a set time gives the rate.
- Counting bubbles released per minute — simple but imprecise, since bubble size varies;
- Measuring the volume of gas collected in a graduated tube or capillary, a more reliable quantitative measure;
- Using an Audus apparatus or a photosynthometer to draw the gas bubble into a calibrated capillary and measure its length.
Other pondweeds such as Cabomba are often substituted for Elodea because they produce a steady, easily counted stream of bubbles. A bicarbonate indicator solution can also be used to track CO2 changes in the surrounding water, and the immobilised algae technique — encapsulating algal cells in alginate beads — allows oxygen and pH changes to be measured in a controlled, reproducible system. A practical consideration in all oxygen methods is that respiration consumes oxygen at the same time photosynthesis produces it, so measured values reflect net rather than gross photosynthesis.
The Hill reaction and the light-dependent stage of photosynthesis
The Hill reaction demonstrates the light-dependent reactions of photosynthesis in isolation, by showing that illuminated chloroplasts can reduce an artificial electron acceptor in place of carbon dioxide. Robert Hill discovered that isolated chloroplasts, when lit, split water and release oxygen even when no CO2 is present, provided a substitute electron acceptor is supplied. In the laboratory, the redox dye DCPIP (dichlorophenolindophenol) serves as that acceptor: it is blue when oxidised and becomes colourless when reduced, so the rate at which a chloroplast suspension decolourises DCPIP under light measures the activity of the light-dependent reactions. This makes the Hill reaction a powerful way to isolate and study the photochemical stage separately from carbon fixation.
Determining photosynthesis by accumulation of organic matter
Measuring dry mass accumulation estimates photosynthesis by weighing the organic material a plant builds over time, since the carbohydrate produced is ultimately stored as plant tissue. This approach measures the net result of photosynthesis after respiratory losses, and it underlies many growth-analysis and crop-yield studies.
The dry-mass increment method
The dry-mass increment method determines photosynthesis from the increase in a plant's dry matter content over a measured interval. A common laboratory version is the leaf-disc dry mass method: discs are cut from a leaf, some are dried and weighed at the start, and matching discs from the same leaf are harvested and weighed after a period of illumination; the gain in dry mass reflects accumulated photosynthate. The related serial harvest technique samples whole plants at intervals during a growing season, drying and weighing them to chart dry matter accumulation over time. The methodology for determining photosynthesis by dry-mass increment is described in the article "Photosynthesis and yield". Because all such measurements compare photosynthetic gain against simultaneous respiratory loss, dry-matter assessment is best interpreted as net productivity over the sampling interval.
Demonstrating starch formation: the Sachs test
The Sachs test proves that starch — a carbohydrate — is formed during photosynthesis, and that light is required for it. A de-starched leaf has a dark paper template with a cut-out shape attached to it; the petiole is placed in water and the leaf exposed to light. In the parts of the leaf not covered by paper, primary starch forms, while the covered parts make none.
The experiment uses a plant that has been kept in the dark and de-starched beforehand. A leaf is cut from this plant and its petiole placed in a small beaker of water (the petiole is first re-cut under water so that uptake proceeds better).
An opaque screen of dark paper or thin card with a cut-out design is fixed to both the upper and lower surfaces of the leaf blade.
The designs of the upper and lower screens must coincide. After the screen is clipped to the leaf, the leaf is exposed for one hour to bright sunlight or electric light. To create more favourable conditions for photosynthesis, the carbon dioxide content and humidity of the air are raised.
For this, the leaf is covered with a glass bell jar, beneath which is placed a dish with a piece of marble or soda doused with dilute sulphuric acid, and a dish of water.
At the end of the experiment the screen is removed from the leaf; a control leaf is then cut from the plant kept in the dark, and both leaves are placed for one minute in boiling water. The leaves are then transferred to a flask with a little alcohol and set on a boiling water bath. Boiling continues until the leaves are decolourised.
The leaves are then lifted out with tweezers and dipped in boiling water for one minute (to soften the tissues). The leaf blade is carefully spread out on a white plate and flooded with a solution of iodine in potassium iodide.
On the illuminated areas of the leaf, abundant starch formation is revealed (a blue or black colouration), while the shaded parts stain yellow. The control leaf is entirely yellow, confirming that light drove the starch production.
Measuring chlorophyll fluorescence
Chlorophyll fluorescence measurement assesses photosynthesis by detecting the small fraction of absorbed light that chlorophyll re-emits as red fluorescence rather than using for photochemistry. When a leaf absorbs light, the energy has three possible fates: it drives the light-dependent reactions, is lost as heat, or is re-emitted as fluorescence. Because these three pathways compete, changes in fluorescence reveal how efficiently the light reactions are working, making it a sensitive, completely non-destructive indicator of photosynthetic performance and plant stress. Fluorometers measure parameters such as the maximum quantum efficiency of photosystem II, which drops when a plant is stressed by drought, heat, or nutrient deficiency before any visible damage appears.
Factors that affect the rate of photosynthesis
Light intensity, carbon dioxide concentration, temperature, and water availability are the main factors that control how fast photosynthesis proceeds. Each of these can become the bottleneck that holds the rate back, and understanding their interaction is essential both for interpreting measurements and for optimising plant growth.
What limiting factors are
A limiting factor is the environmental variable in shortest supply that, at any given moment, sets the maximum possible rate of photosynthesis. The concept means that increasing other factors will not raise the rate until the limiting one is also increased — if light is scarce, adding more carbon dioxide does nothing until light is raised first. Identifying which factor is limiting is the central goal of many photosynthesis experiments and of greenhouse management.
Light intensity and the rate of photosynthesis
Light intensity drives the rate of photosynthesis up to a saturation point, after which further light produces no additional increase. At low light, the rate rises in direct proportion to intensity because the light-dependent reactions are starved of energy; as intensity climbs, the curve levels off when some other factor — often carbon dioxide or temperature — takes over as the limiting factor. Water availability also constrains the process, because a plant short of water closes its stomata, cutting off the carbon dioxide supply and lowering the rate regardless of how much light is present.
Calculating light intensity and the inverse square law
Light intensity reaching a plant from a point source is calculated using the inverse square law, which states that intensity is inversely proportional to the square of the distance from the source. Expressed as a formula, light intensity ∝ 1 / d², where d is the distance between the lamp and the plant. This means that doubling the distance reduces the light reaching the plant to a quarter, not a half — a relationship that must be controlled carefully in any experiment using a lamp, because small changes in distance produce large changes in light intensity.
Carbon dioxide concentration as a limiting factor
Carbon dioxide concentration limits photosynthesis whenever light is plentiful but CO2 is in short supply, because carbon dioxide is the raw material fixed into sugar in the Calvin cycle. The relationship between CO2 and photosynthesis rate is direct over the normal range: raising the carbon dioxide concentration increases the rate until another factor becomes limiting or the carbon-fixing enzymes are saturated. Commercial greenhouses exploit this by enriching the air with carbon dioxide, since atmospheric levels (around 0.04%) are often below the optimum for many crops.
Temperature and the denaturation of photosynthetic enzymes
Temperature raises the rate of photosynthesis up to an optimum and then sharply lowers it as the enzymes that catalyse the reactions denature. Photosynthesis depends on enzymes, and like all enzyme-driven processes its rate increases with temperature only until the optimum — typically around 25–35 °C for many temperate plants — is reached. Beyond that point, high temperatures distort the three-dimensional shape of the enzymes, denaturing them and causing the rate to fall steeply. This is why temperature must be held constant in controlled experiments and managed carefully in protected cultivation. Multiple factors interact: at any moment the actual rate is set by whichever of light, carbon dioxide, and temperature is most limiting.
Experimentally investigating the effect of light on photosynthesis
The effect of light on photosynthesis is investigated by varying the distance between a lamp and an aquatic plant such as Elodea or Cabomba and measuring the resulting oxygen output. A typical protocol places pondweed in bicarbonate indicator solution, positions a lamp at a set distance, allows the plant to acclimatise, and then counts oxygen bubbles or measures gas volume over a fixed period. Moving the lamp to several measured distances and applying the inverse square law converts each distance into a light-intensity value, producing paired data of light intensity against photosynthesis rate. This experiment is a standard practical in courses such as SQA National 5 Biology and is widely described in educational resources from organisations like the BBC.
Interpreting photosynthesis rate graphs
A photosynthesis rate graph is interpreted by reading the shape of the curve: a straight rising line means the plotted factor is limiting, and a plateau means a different factor has taken over. When the rate of photosynthesis is plotted against light intensity, the initial steep, straight portion shows that light is the limiting factor; where the curve flattens into a horizontal plateau, light is no longer limiting and carbon dioxide or temperature now caps the rate. Reading such graphs lets an investigator identify exactly which factor constrains the plant under each set of conditions, which is the practical payoff of the experiment.
Commercial equipment and instruments for measuring photosynthesis
Commercial photosynthesis systems package an infrared gas analyser, a leaf chamber, and environmental controls into portable instruments that measure carbon dioxide and water-vapour exchange on intact leaves in the field. These systems let researchers control light, temperature, humidity, and CO2 around a leaf while logging the gas exchange. Examples include:
- The CI-340 Handheld Photosynthesis System from CID Bio-Science, a portable IRGA-based instrument for field measurement of carbon assimilation, transpiration, and stomatal conductance;
- The F-920 Gas Analyzer, used to measure carbon dioxide and other gases in plant and atmospheric studies;
- Chlorophyll fluorometers, which assess photosystem efficiency non-destructively.
Writing for CID Bio-Science, Scott Trimble has documented how handheld IRGA instruments brought laboratory-grade gas-exchange measurement into the field, and methodological studies in journals such as those published by MDPI continue to refine these techniques. The trend across commercial equipment is toward portability, continuous logging, and non-destructive sampling.
Applications of photosynthesis analysis in science and industry
Photosynthesis analysis is used across plant physiology, agronomy, forestry, ecology, climate science, and precision agriculture to optimise growth, predict yield, and model carbon exchange. The reasons photosynthesis matters to both life and industry are wide-ranging:
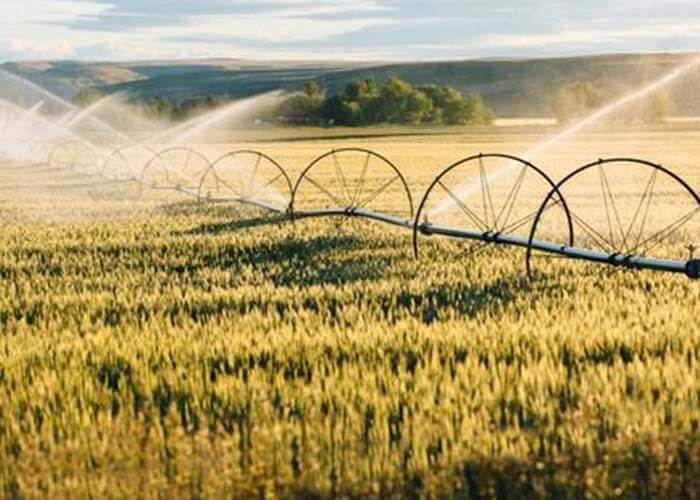
- Precision agriculture uses photosynthesis and CO2 data to fine-tune irrigation, lighting, and carbon enrichment in greenhouses and controlled-environment farms;
- Crop breeding and physiology rely on gas-exchange and fluorescence measurements to screen varieties for higher productivity and stress tolerance;
- Climate and ecosystem science quantifies global photosynthesis rates to understand the carbon cycle and the capacity of vegetation to absorb atmospheric carbon dioxide;
- Plant stress research detects drought, heat, and nutrient problems early through chlorophyll fluorescence before visible symptoms appear.
Because photosynthesis underpins food production, the oxygen supply, and the global carbon balance, measuring it accurately serves disciplines from fundamental biology to applied sciences and commercial horticulture.
Comparing the methods for determining photosynthesis rate
The best method for measuring photosynthesis depends on whether continuous, non-destructive measurement is needed and on the equipment available; each approach has distinct strengths and trade-offs. The table below summarises how the main methods compare.
| Method | What it measures | Destructive? | Best suited to |
|---|---|---|---|
| CO2 uptake (titration: Ivanov–Kossovich, Krasnoselskaya-Maksimova–Ordoyan) | Carbon dioxide absorbed | No | Classic closed- and open-system laboratory work |
| Infrared gas analysis (IRGA) | Carbon dioxide exchange, continuously | No | Field and research measurement, long recordings |
| Electrochemical gas sensors | Carbon dioxide concentration | No | Greenhouse and precision-agriculture monitoring |
| Oxygen evolution (Elodea/Cabomba, Audus apparatus) | Oxygen released (net) | No | Teaching and introductory experiments |
| Hill reaction (DCPIP) | Light-dependent reactions only | Yes | Studying the photochemical stage in isolation |
| Dry-mass increment (leaf disc, serial harvest) | Organic matter accumulated (net) | Yes | Growth analysis and crop-yield studies |
| Chlorophyll fluorescence | Light-reaction efficiency | No | Stress detection and rapid screening |
A key consideration running through every method is the distinction between net and gross photosynthesis: oxygen and dry-mass methods record the net result after respiration, whereas isolating the Hill reaction or measuring fluorescence gets closer to the photochemical process itself. For continuous, non-invasive work on living plants, the gas-exchange method based on infrared optical-acoustic analysers is the standard, as described in the article "Timiryazev's contribution to the study of photosynthesis". Infrared beams passed alternately through a leaf chamber and a reference chamber are absorbed by carbon dioxide, and the degree of absorption indicates the CO2 content; because the instrument carries a recorder, photosynthesis can be tracked over long periods.
Equally valuable is the method that tracks the rate of carbon dioxide uptake using carbon-14 (C14) in plant leaves, described further in the article "The labelled-atom method in biology". These radioactive-tracer methods are especially useful because they reveal not only the rate of carbon fixation but also the quality of the products formed during photosynthesis and the speed at which those products move from the leaves to other organs of the plant.